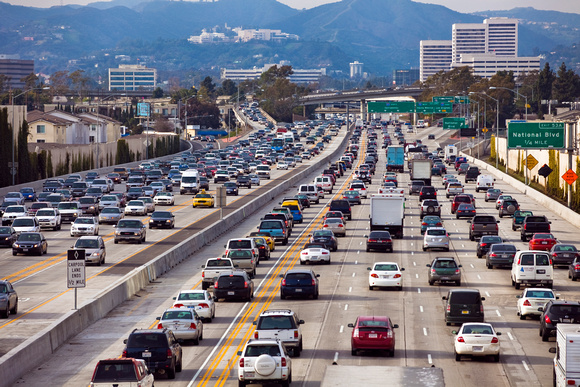
Thousands of Americans are dying in terrible car crashes every year
The rate of car crash fatalities varies across countries
The World Health Organization’s Global Status Report on Road Safety 2013 estimates 1.24 million traffic deaths a year – nearly triple the UN’s estimate of annual murders, and twenty times the estimated annual total of deaths in wars. Only 28 countries have adequate laws that address all five risk factors (speed, drink–driving, helmets, seat-belts and child restraints). The average rate was 17.4 per 100,000 population. Low-income countries now have the highest annual road traffic fatality rates, at 24.1 per 100 000 population, while the rate in high-income countries is lowest, at 9.2 per 100000 population. Compare to other countries, U.S. is relatively safe. However, there were 30,057 fatal motor vehicle crashes in the United States in 2013 in which 32,719 deaths occurred.
Source: World Health Organization
Hover on the map to see the detailed data
The fatal motor vehicle crashes rate in the United States
Hover on the line to see the detailed data
According to the line chart, six states with the highest highway fatality rates per 100,000 people in 2013 are Montana (22.6), Mississippi (20.5), North Dakota (20.5), West Virginia (17.9) and Alabama and Oklahoma (17.6).The lowest highway fatality rates in 2013 were posted in the District of Columbia (3.1), Massachusetts (4.9), New Jersey (6.1), New York (6.1) and Rhode Island (6.2). The wide different death rate may due to different population in each states and disparate local road law. Montana is the nation’s crash-death capital; its fatal car-accident rate is more than many other states. Compare to Montana, a significant decrease is observed in the death rate of Wyoming. The decreasing are attributed to the reduction in the number of commercial carrier crashes, multivehicle crashes and alcohol-related crashes.
Source:Highway Loss Data Institute
Human error causes crashes happen

Source: Images from Bing picture
Source: NHTSA Fatal Accident Reporting System / Auto Insurance Center
source:Highway Loss Data Institute
source:Highway Loss Data Institute
Click on the button below to see the different crashes death rate by different impaired
Click the buttons to see the comparison of Crash Fatalities by Sex and Age Group
Three tips for avoiding car crashes in the future
1. Changing bad driving behavior could reduce the risk of death in a car crash. The charts above indicate that bad human behavior would cause needless accident. In order to avoid accidents , following the rules and regulations of the road is very important. Driver should never drink and drive. Drinking too much will impairs people's reaction time and judgement. Speeding is a serious problem causing crashes, therefore, tailor driving speed to the conditions is necessary. People could minimize car accidents by maintaining a constant speed and leaving enough distance with other vehicles. 2. People should keep in mind that don't use the cell phone or eat food or others things which will affect the safe driving condition. Distracted driving is a bad driving behavior. When people couldn't give full attention to the road, the accident crash may happen to you. Lots of people using cell phone or eating food while driving, which is a seriously dangerous problem could effect on your attention on driving. For a save driving trip, people should fully pay attention to drive and actively scan the road. 3. Using seat belt is a vital part of safe driving and the most effective way to protect people from unwanted death and injury. Always make sure using the seat belts while driving. Wearing a seat belt can reduce the risk of fatal crashes and injury,therefore, using seat belts in passenger vehicles is very essential.